Kubernetes Monitoring with Prometheus & Grafana
60 Days DevOps Challenge: Day 47
By Sandip Das · · 10 min read
💡
Hey — It's Sandip Das 👋
Monitoring is critical for understanding what’s happening in your Kubernetes cluster. Today, you’ll deep dive into using Prometheus for metrics collection and Grafana for visualization.
You’ll also explore how to monitor pods, nodes, apps, and system components with powerful queries and dashboards.
Monitoring is critical for understanding what’s happening in your Kubernetes cluster. Today, you’ll deep dive into using Prometheus for metrics collection and Grafana for visualization.
You’ll also explore how to monitor pods, nodes, apps, and system components with powerful queries and dashboards.
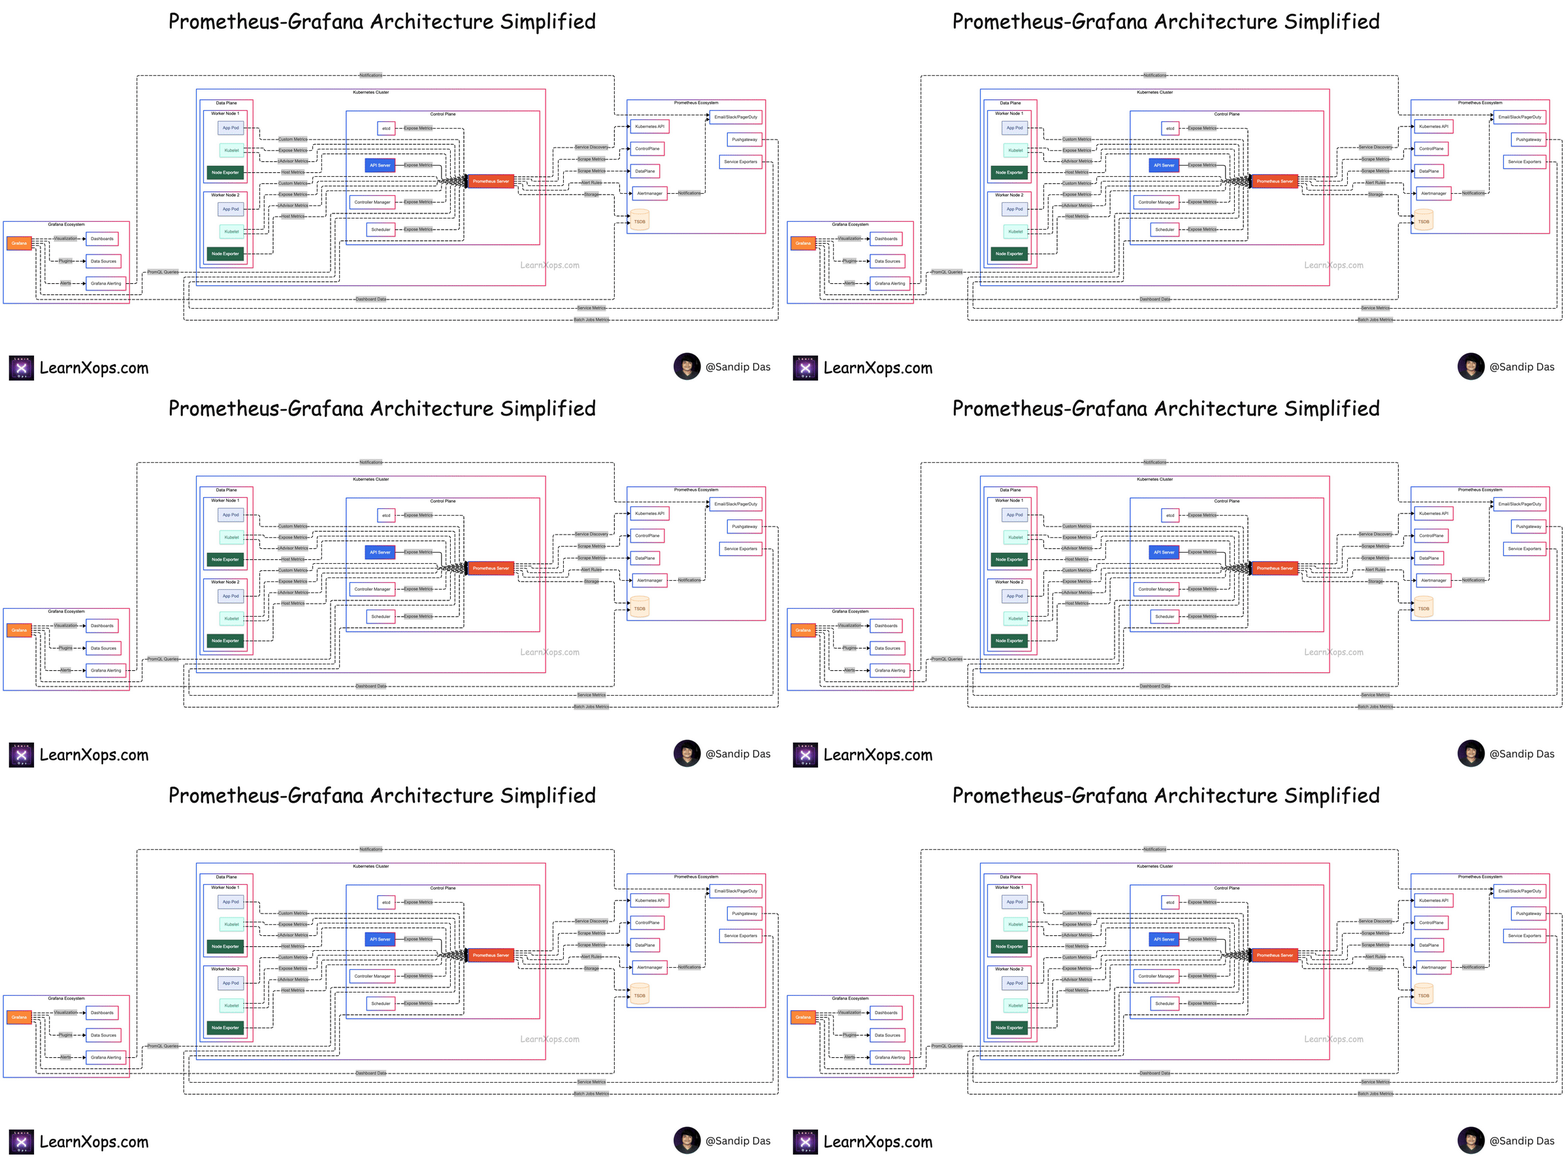
Download a high-resolution
Read the full article on learnxops.com.
Topics: DevOps, Kubernetes, Community, Prometheus, Grafana, News, 60 Days of DevOps