Distributed Tracing & Observability for Kubernetes Microservices using Jaeger, OpenTelemetry & Grafana Tempo
60 Days DevOps Challenge: Day 56
By Sandip Das · · 12 min read
💡
Hey — It's Sandip Das 👋
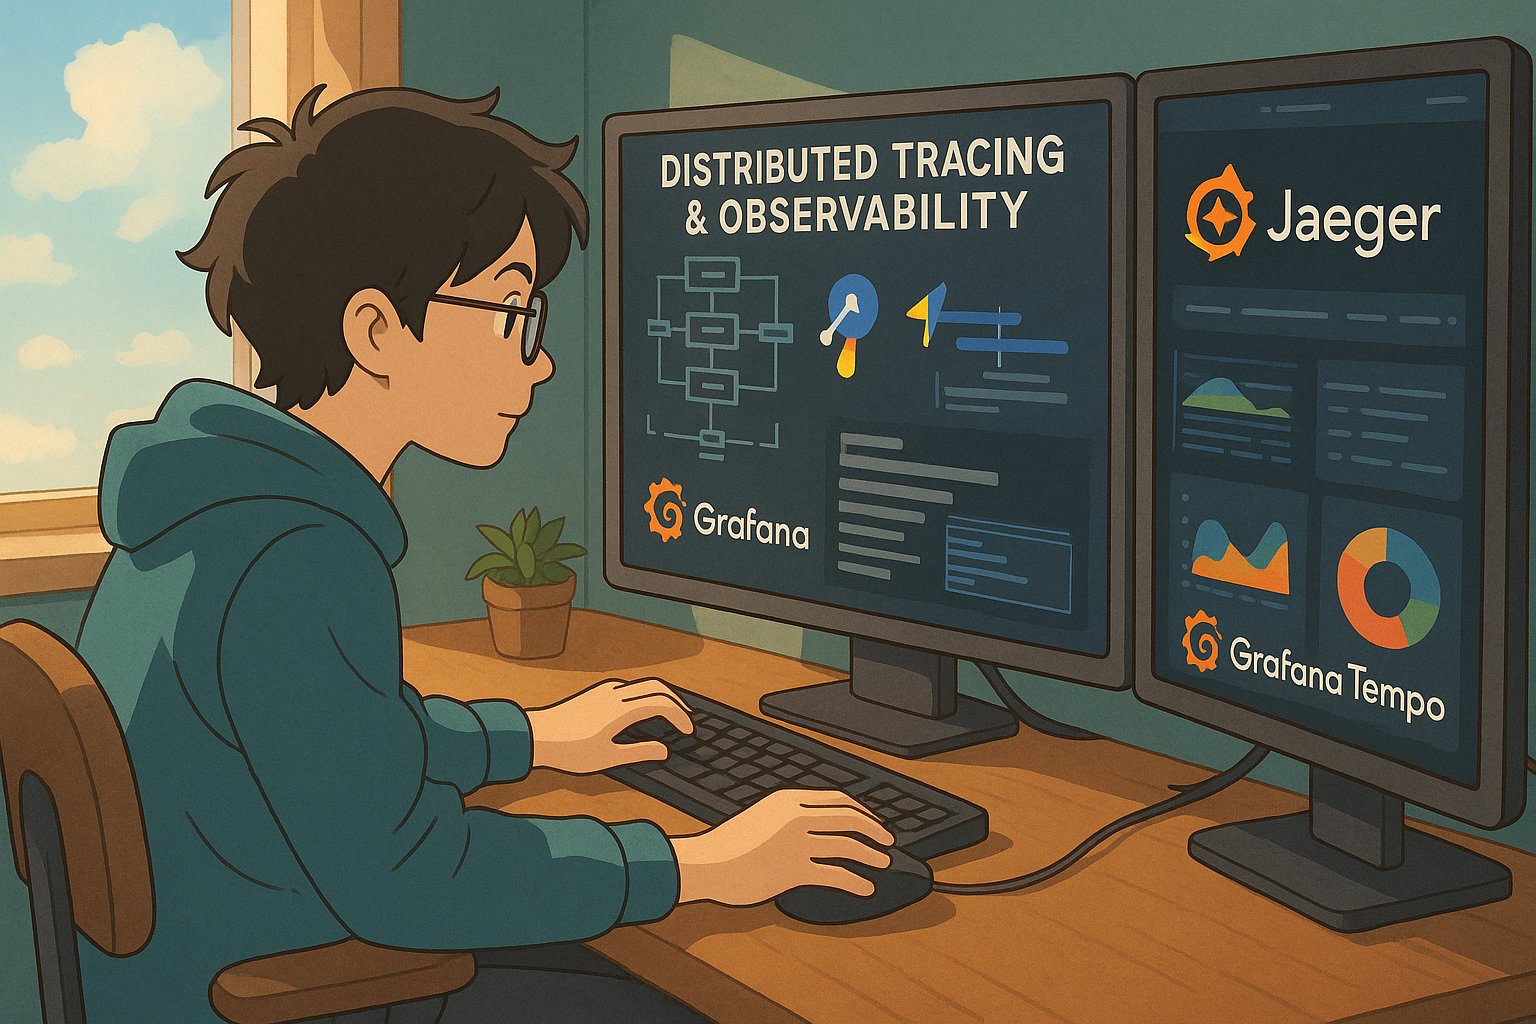
In complex microservices architectures, traditional logs and metrics aren’t always enough to diagnose performance issues or trace requests across services. That’s where distributed tracing comes in.
Today you’ll explore Jaeger, OpenTelemetry, and Grafana Tempo to build end-to-end observability for your applications.
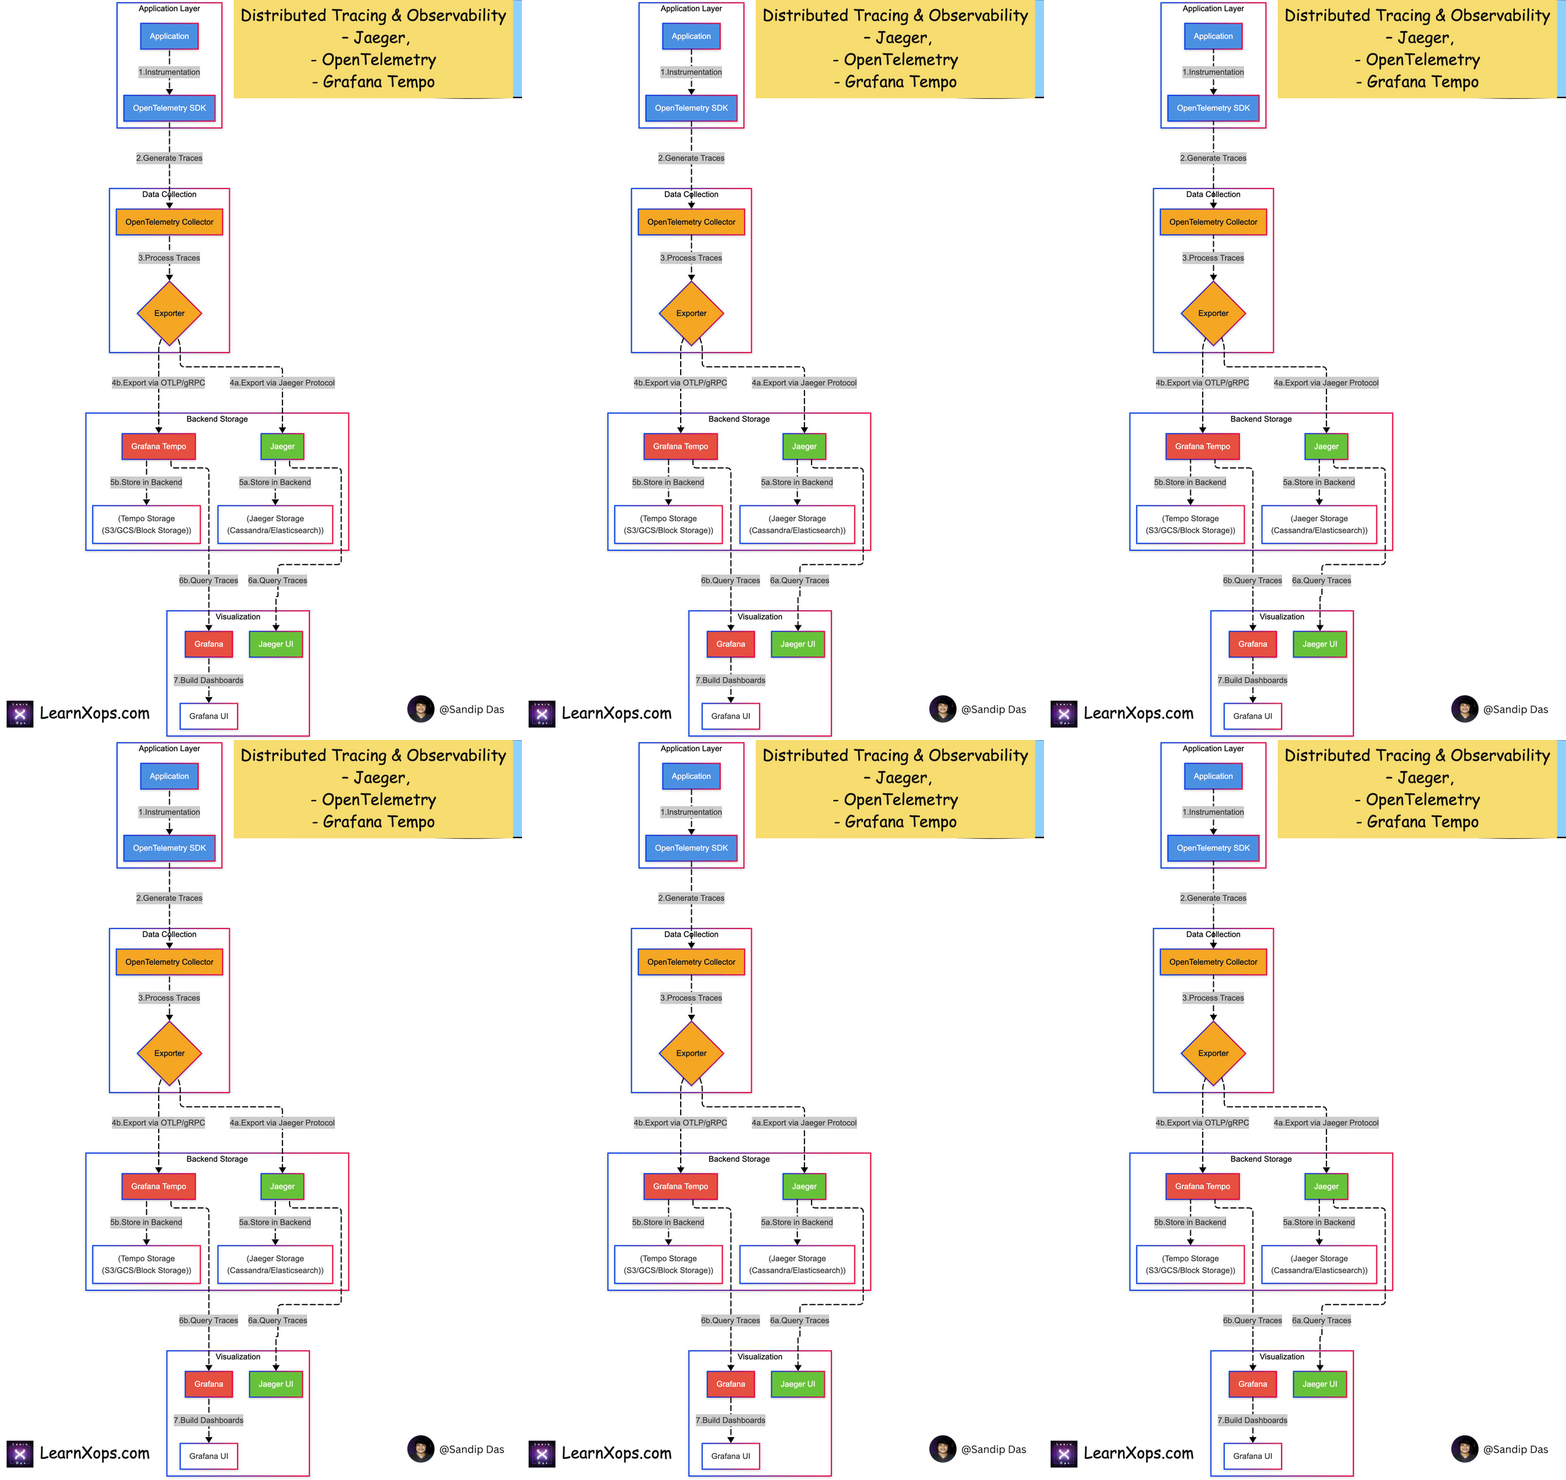
Download a high-resolution
Read the full article on learnxops.com.
Topics: Tracing, Observability, Kubernetes, Community, Jaeger, OpenTelemetry, Grafana Tempo, News, 60 Days of DevOps